Splunk Powershell Event Correlation Lab
Splunk PowerShell Multi-Event Correlation Investigation
Investigating PowerShell Web Requests Across Multiple Windows Event Sources
Overview
This project documents a hands-on SOC investigation focused on correlating PowerShell activity across multiple Windows telemetry sources using Splunk SIEM.
The objective of the lab was to simulate suspicious PowerShell web activity and investigate how the same attacker behavior appears across different Windows event sources and telemetry providers.
Using Splunk, Sysmon, PowerShell Operational Logs, and Windows Security Logs, I tracked a PowerShell command that accessed an external website and correlated the resulting telemetry using ProcessGuid to simulate a real SOC investigation workflow.
This investigation provided visibility into:
- PowerShell execution
- Script Block Logging
- DNS activity
- Process creation
- Parent-child process relationships
- Network-related behavior
- Cross-event telemetry correlation
Lab Objective
The goal of the investigation was to:
- Generate PowerShell web activity
- Observe how the activity appears across multiple event sources
- Investigate Event IDs 1, 22, 4104, and 4688
- Correlate the activity using ProcessGuid
- Understand how defenders reconstruct attacker behavior during investigations
Telemetry Generation
The following command was executed from PowerShell:
powershell -c "Invoke-WebRequest https://example.com"
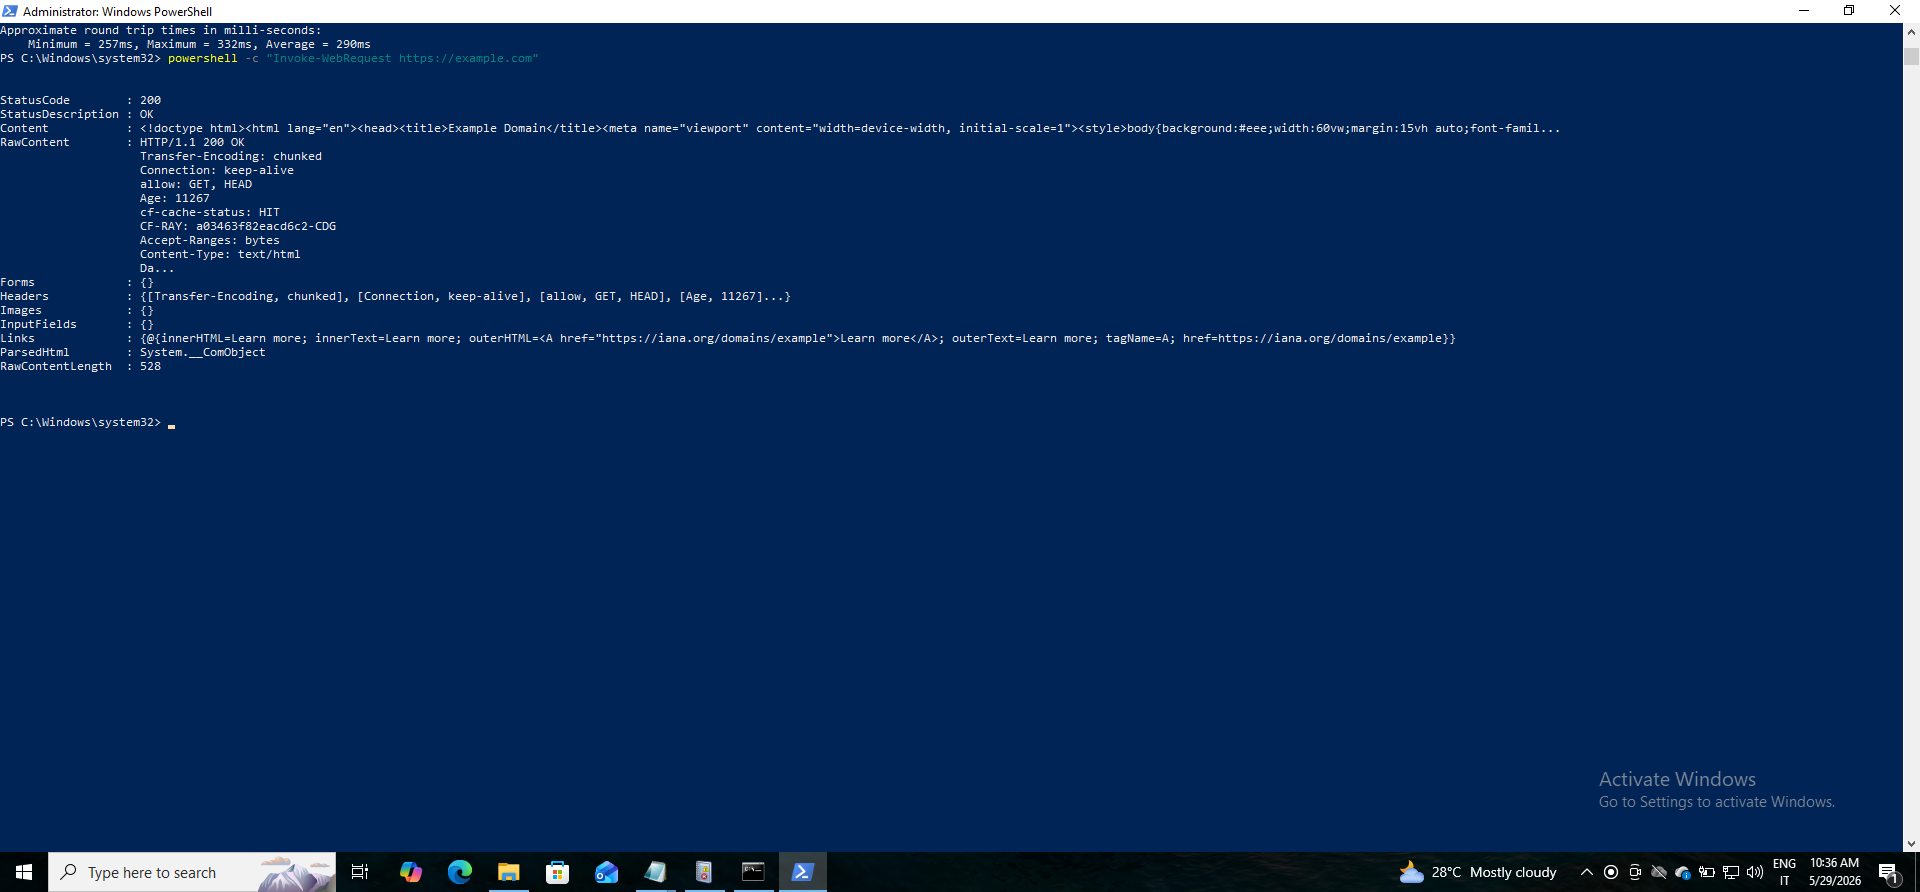
This simulated:
- External web communication
- PowerShell command execution
- Potential malware download behavior
- Suspicious scripting activity
Although the command was benign, it closely resembles real attacker behavior commonly observed in phishing payloads, malware download cradles, and fileless attacks.
Splunk Investigation
The following Splunk search was used to identify related telemetry:
index=wineventlog powershell example.com
This search returned multiple related Windows events associated with the same activity.
The investigation identified the following event codes:
| Event ID | Purpose |
|---|---|
| 1 | Sysmon Process Creation |
| 22 | Sysmon DNS Query |
| 4104 | PowerShell Script Block Logging |
| 4688 | Windows Process Creation |
This demonstrated how a single attacker action can generate multiple telemetry artifacts across Windows logging systems.
Event Correlation Using ProcessGuid
To simulate a real SOC investigation workflow, I correlated the events using:
ProcessGuid
The same ProcessGuid appeared across multiple Sysmon events, allowing reconstruction of the activity timeline.
This demonstrated how defenders trace attacker activity across:
- Process execution
- PowerShell logging
- DNS activity
- Parent-child process relationships
Process correlation is a critical SOC investigation skill because attackers rarely generate only a single event.
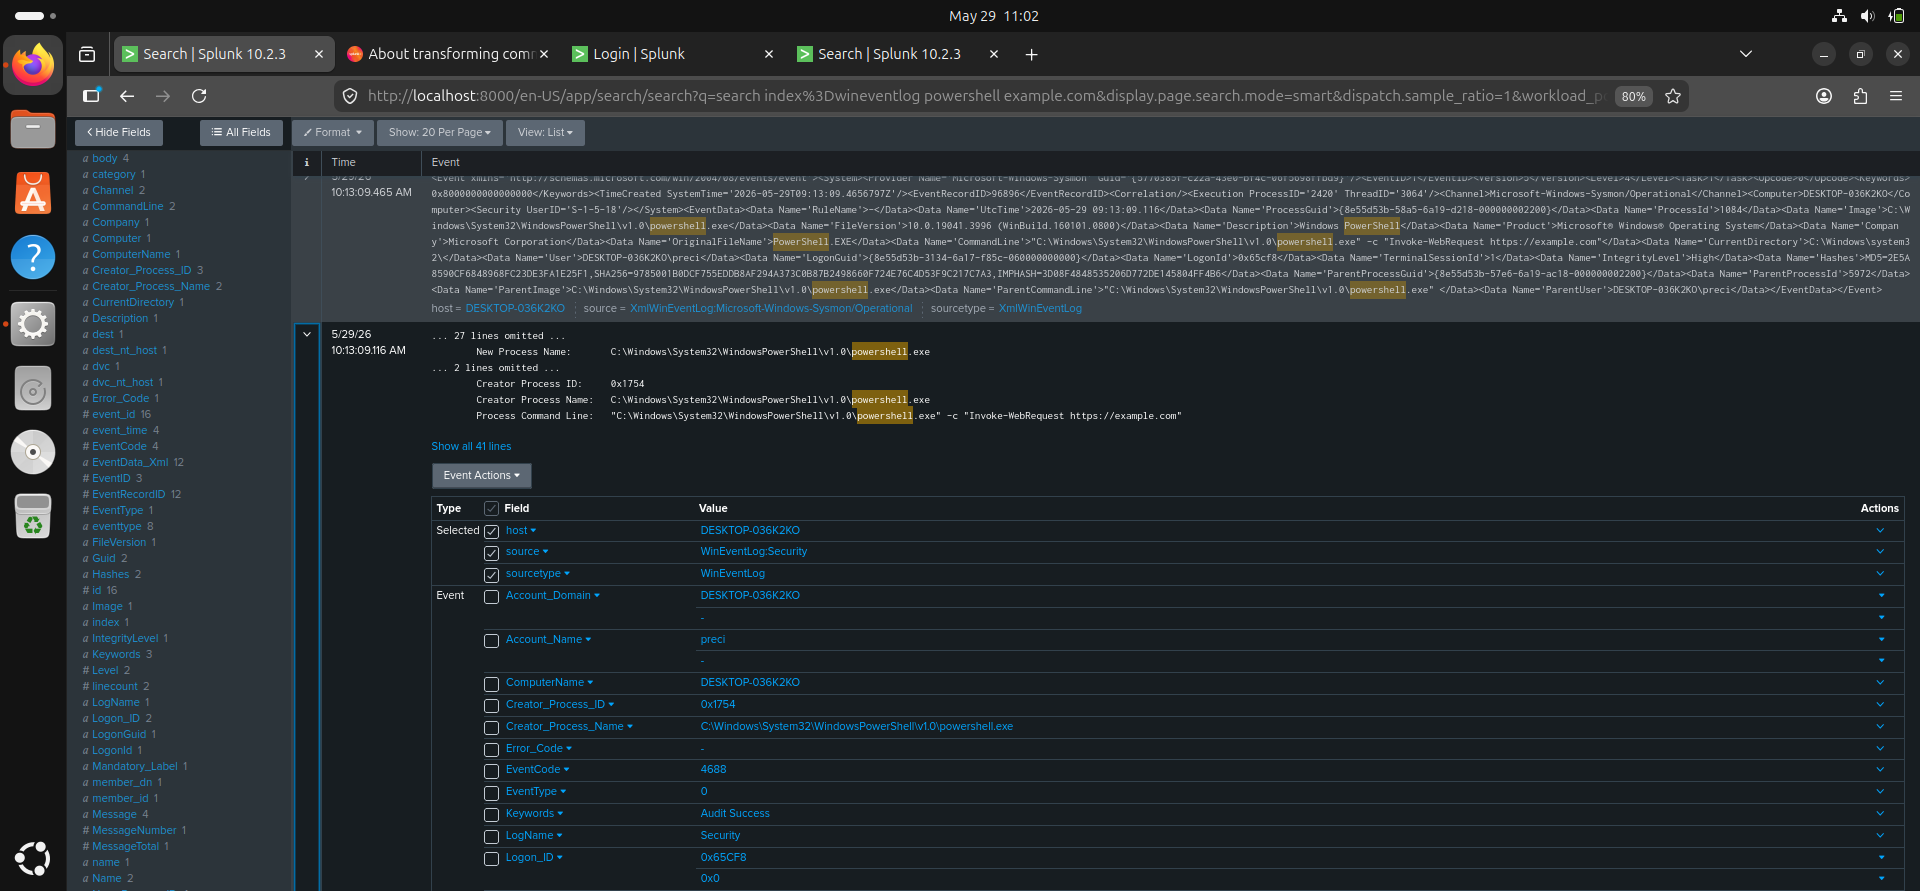
Event ID 4688 — Windows Process Creation Analysis
What Was Observed
Windows Security Event ID 4688 revealed that a new PowerShell process was created.
Important fields identified included:
| Field | Value |
|---|---|
| New Process Name | powershell.exe |
| Account Name | preci |
| Process Command Line | powershell -c “Invoke-WebRequest [https://example.com](https://example.com)” |
| Creator Process Name | powershell.exe |
| Token Elevation Type | %%1937 |
| Mandatory Label | High Integrity |
Investigation Analysis
The event confirmed:
- PowerShell execution
- Command-line visibility
- User context
- Elevated execution context
- Parent-child process relationship
The process command line clearly exposed:
Invoke-WebRequest https://example.com
This is extremely valuable because attackers frequently use:
- Invoke-WebRequest
- IEX
- DownloadString
- Web requests
to retrieve payloads from external infrastructure.
Understanding Token Elevation
The investigation also revealed:
Token Elevation Type: %%1937
This indicates elevated execution privileges under User Account Control (UAC).
High-integrity PowerShell execution is important because elevated PowerShell processes provide attackers with greater capabilities for:
- Persistence
- Credential theft
- Lateral movement
- Security bypass attempts
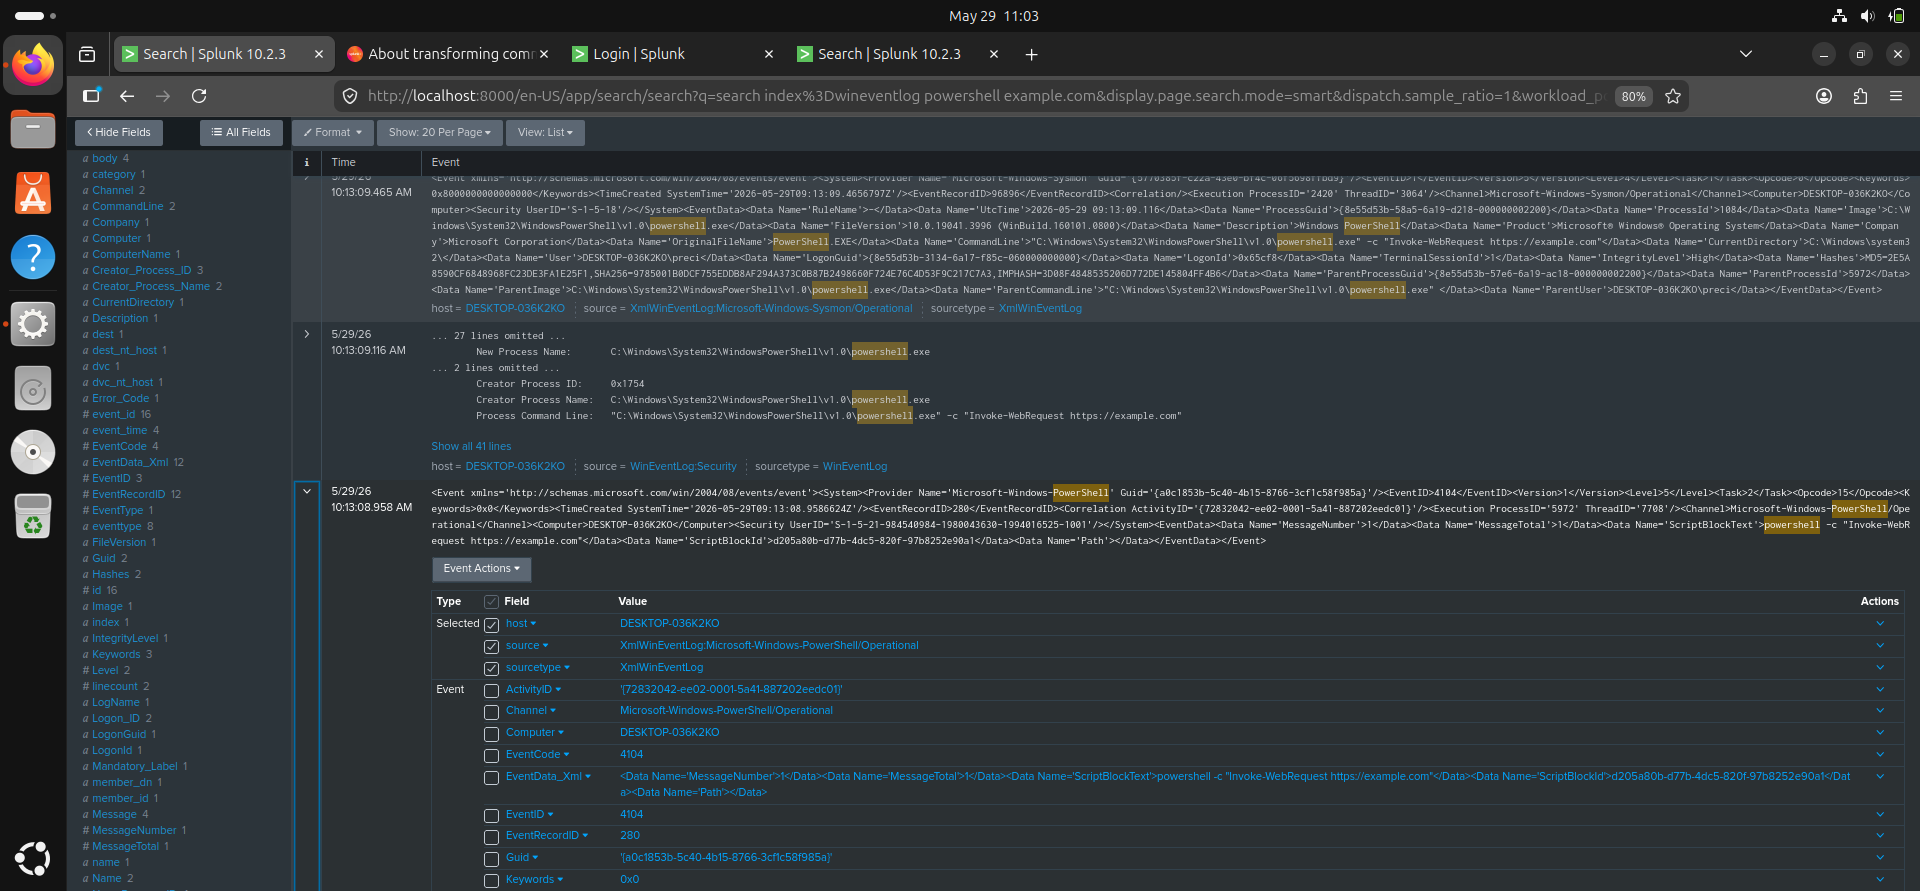
Event ID 4104 — PowerShell Script Block Logging
Why Event ID 4104 Matters
PowerShell Script Block Logging is one of the highest-value telemetry sources in Windows security monitoring because it reveals the actual PowerShell code executed on the system.
Unlike standard process creation logs, Event ID 4104 exposes:
- Executed PowerShell commands
- Download activity
- Obfuscated scripts
- In-memory execution behavior
First Script Block Observed
The first Event ID 4104 revealed:
powershell -c "Invoke-WebRequest https://example.com"
This captured the initial PowerShell execution command.
Second Script Block Observed
A second Event ID 4104 revealed:
Invoke-WebRequest https://example.com
This showed the actual PowerShell cmdlet executed within the PowerShell session.
This demonstrates how Script Block Logging can expose the real command logic used by attackers.
Why ScriptBlockText Is Important
The following field was especially valuable:
ScriptBlockText
This field provides direct visibility into executed PowerShell content.
Defenders may use ScriptBlockText to identify:
- Download cradles
- Malicious URLs
- Encoded payloads
- Credential theft activity
- Obfuscation
- Reconnaissance commands
This makes Event ID 4104 extremely powerful for threat hunting and incident investigations.
Event ID 1 — Sysmon Process Creation
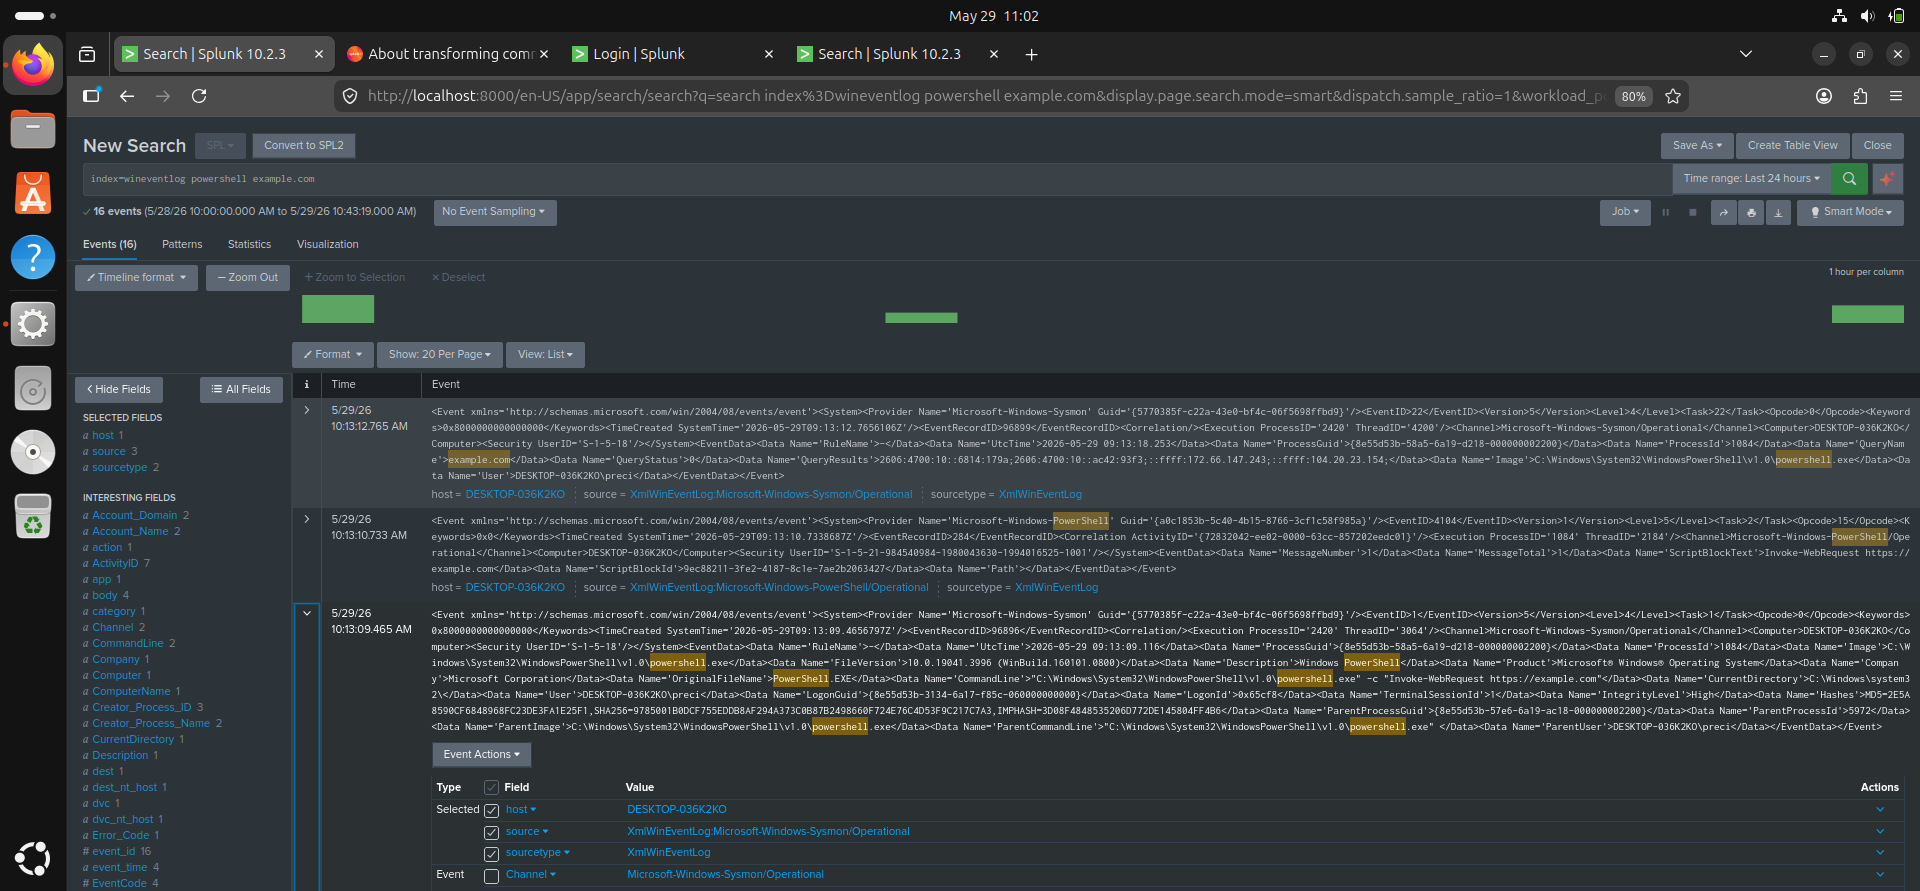
Sysmon Event ID 1 provided deeper process visibility than standard Windows logging.
Important fields observed included:
| Field | Value |
|---|---|
| Image | powershell.exe |
| CommandLine | powershell -c “Invoke-WebRequest [https://example.com](https://example.com)” |
| IntegrityLevel | High |
| ProcessGuid | {8e55d53b-58a5-6a19-d218-000000002200} |
| ParentImage | powershell.exe |
| User | DESKTOP-036K2KO\preci |
Investigation Findings
This event confirmed:
- PowerShell execution
- Process lineage
- User attribution
- Integrity level
- Parent-child relationships
- Command-line visibility
The ProcessGuid became extremely important because it allowed event correlation across multiple telemetry sources.
Parent-Child Process Analysis
The investigation revealed:
powershell.exe
        └── powershell.exe
                └── Invoke-WebRequest execution
This nested PowerShell execution pattern is important because attackers frequently chain PowerShell sessions together during:
- Malware execution
- Obfuscation
- In-memory attacks
- Script execution frameworks
Event ID 22 — Sysmon DNS Query Investigation
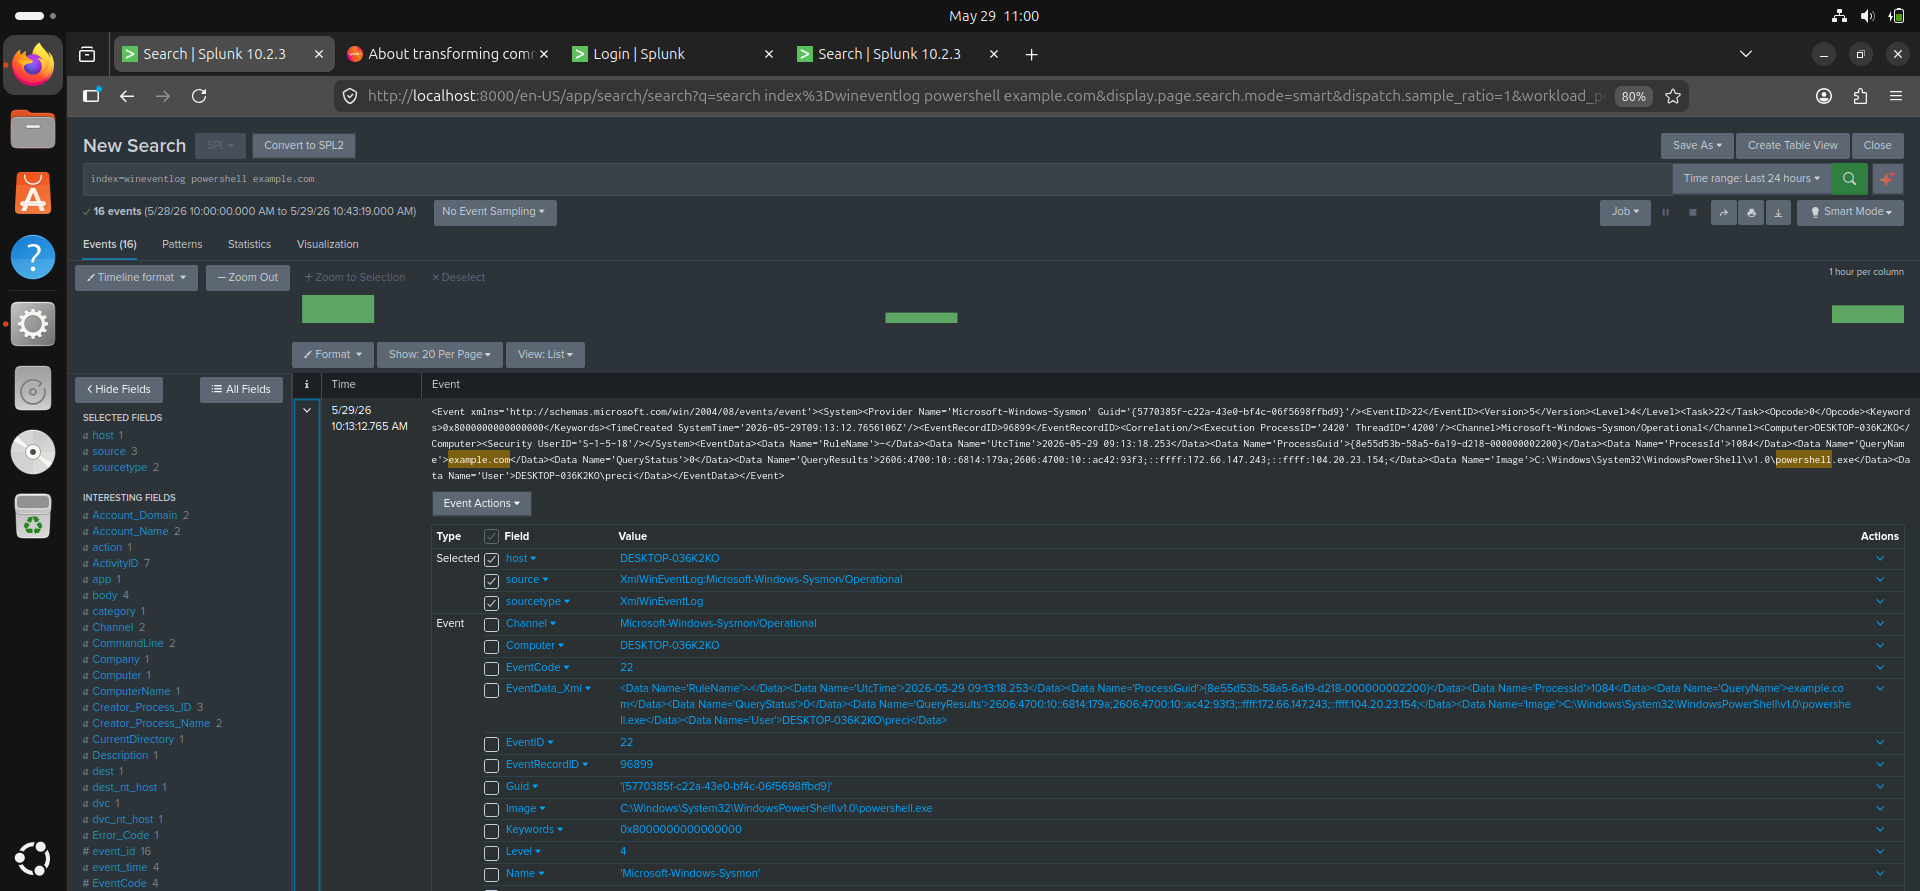
Sysmon Event ID 22 revealed DNS resolution activity associated with the PowerShell command.
Important fields included:
| Field | Value |
|---|---|
| QueryName | example.com |
| Image | powershell.exe |
| ProcessGuid | {8e55d53b-58a5-6a19-d218-000000002200} |
| QueryResults | Multiple resolved IP addresses |
Why DNS Telemetry Matters
DNS telemetry is extremely valuable because attackers often rely on DNS to:
- Reach command-and-control infrastructure
- Download payloads
- Communicate externally
- Resolve malicious domains
Sysmon DNS logging helps defenders identify suspicious outbound activity even when full packet capture is unavailable.
Cross-Event Correlation Findings
Using ProcessGuid correlation, I reconstructed the full activity chain:
powershell.exe
        └── Invoke-WebRequest execution
                └── DNS resolution for example.com
                        └── ScriptBlockText visibility
This demonstrated how a single attacker action generates multiple telemetry artifacts across:
- Windows Security Logs
- PowerShell Operational Logs
- Sysmon Process Events
- Sysmon DNS Events
Why This Matters for SOC Operations
Modern SOC investigations depend heavily on telemetry correlation rather than isolated events.
Attackers rarely generate a single log entry.
Instead, defenders reconstruct attack stories by correlating:
- Process creation
- Script execution
- Network activity
- DNS queries
- Authentication activity
- Parent-child process relationships
This lab simulated that workflow using Splunk.
Key Detection Concepts Learned
Through this investigation, I gained practical experience in:
- PowerShell threat hunting
- Event correlation
- Script Block Logging analysis
- DNS telemetry analysis
- Process creation monitoring
- Parent-child process investigation
- Splunk investigation workflows
- Threat reconstruction techniques
Why PowerShell Is Heavily Abused
PowerShell is heavily abused because it:
- Is trusted by Windows
- Supports scripting and automation
- Enables in-memory execution
- Can execute without writing files to disk
- Allows remote administration
- Is commonly used in enterprise environments
This makes malicious PowerShell activity difficult to distinguish from legitimate administration.
Why Attackers Use Obfuscation and Encoded Commands
Attackers commonly use:
- Base64 encoding
- Obfuscation
- Nested PowerShell execution
- Hidden windows
- Encoded payloads
to evade:
- Signature detections
- Antivirus products
- Security monitoring tools
This is why defenders rely heavily on:
- ScriptBlockText
- Process lineage
- PowerShell logging
- Event correlation
during investigations.
Challenges Encountered
Some challenges encountered during the investigation included:
- Understanding relationships between multiple event sources
- Correlating events using ProcessGuid
- Interpreting ScriptBlockText
- Understanding nested PowerShell execution
- Distinguishing normal vs suspicious PowerShell activity
Resolving these challenges improved my understanding of Windows telemetry and SOC investigation workflows.
Conclusion
This lab improved my understanding of how defenders investigate PowerShell activity across multiple Windows telemetry sources using Splunk SIEM.
By correlating Event IDs 1, 22, 4104, and 4688, I gained practical experience in:
- Threat hunting
- PowerShell investigations
- DNS telemetry analysis
- Event correlation
- Script Block Logging analysis
- Process lineage investigation
- SOC workflow reconstruction
This project strengthened my understanding of how modern SOC analysts reconstruct attacker behavior using layered Windows telemetry and SIEM correlation techniques.
Author
Precious Anyanwu
| Cybersecurity Learner | SOC Analyst Path | Splunk SIEM Practice |